UPDATE [11 July 2024] This post, first published on 13 June, has been edited. See the addition under the Methodology heading below. We’re not putting too much weight on its claims now we have looked at the methodology involved.
For years, I’ve been worried that professional valuers in New Zealand might not properly account for the superior performance of a certified Passive House building. The argument has always been a bit of a chicken-and-egg situation: valuers claim they base their numbers on what the market is willing to pay, but with so few Passive House certified homes hitting the market, there’s no clear sales data to prove the premium. It’s a frustrating loop that has held back a lot of good projects, mostly speculative development. There’s only one case I can point to in New Zealand: Passive House certification, among other non-standard features, added 12% to the valuation.
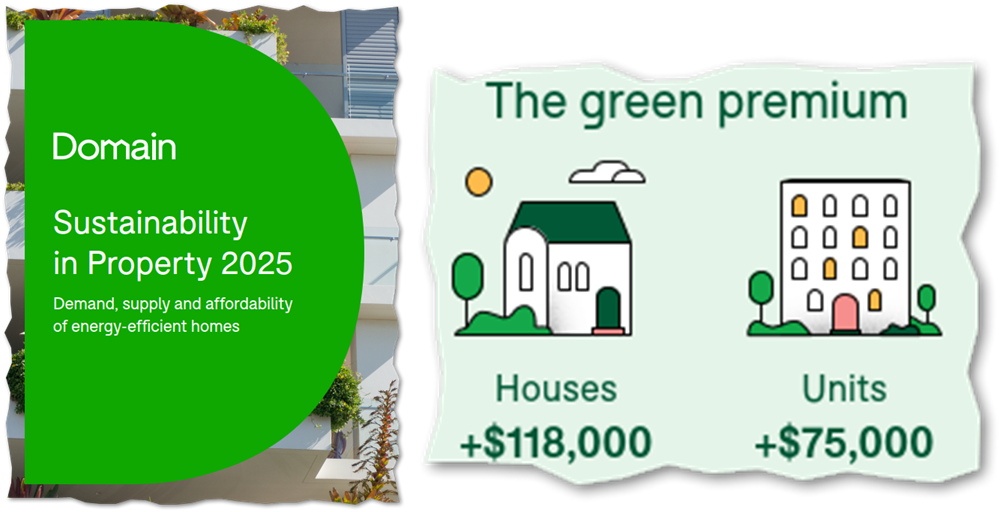
The Domain Sustainability in Property 2025 report released in June made a series of eye-catching claims about houses with energy-efficient features sell for 15% more than their not energy-efficient counterparts, which translates to a median dollar difference of A$118,000. For units, the premium is 12%, or A$75,000. Even on projects that pivot to Passive House performance late in the design, the extra costs don’t reach those sorts of percentages.
The report suggests that middle-income households are a key driver of demand for more energy-efficient homes, motivated by long-term cost savings and environmental concerns. This directly contradicts the idea that people on average incomes aren’t focused on their energy bills.
I’m frustrated that we don’t have data like this for New Zealand. We’re left to extrapolate from Australian trends. However, the influence of policy is undeniable. The Australian Capital Territory (ACT), with its mandatory energy-efficiency disclosure at the point of sale, shows the highest proportion of homes marketed with energy-efficient features. It’s a clear case study for what happens when you build market transparency: when buyers have the information, they make smarter choices, and the market responds.
Fundamentally, if we want to make the Passive House standard mainstream, getting the valuation right is critical. It’s the key that unlocks bank financing and gives builders and homeowners the confidence to invest in quality. This Australian report provides a powerful precedent. It shows that when you have a critical mass of better buildings and transparent data, the market doesn’t just see the value—it pays for it.
Methodology
Keep in mind this report was generated by a property sales website. If independent, qualified researchers were involved, there’s no mention of that. Methodology is a meagre 95 word section up the back (see page 24 of the report). The report conclusions are based on analysing the frequency of search terms and then comparing the reported sale price of homes with those features compared to those without.
The research set the bar very low: any home which included these words in its property listing was considered a genuinely sustainable home: North-facing, double-glazed, eco, solar, solar panel, sustainable, and heat recovery ventilation. There’s some vagueness about whether other terms were also included, but this is the list disclosed in methodology. There’s a big difference between double-glazed and heat recovery ventilation and eco or sustainable. The first two are specific products or systems—quality will vary but they are either present or not. Eco and sustainable aren’t precise or reliable terms when used by people trying to sell you something. And there are many factors that explain why one house sells for more than another but there’s no suggestion there’s been any attempt to deal with confounding variables.
AbstractDomain Sustainability in Property Report 2025
This report analyses property listings and sales data from across Australia to quantify the value of energy-efficient homes. It finds that homes marketed with energy-efficient features command a significant price premium, attract more buyer interest, and are becoming increasingly mainstream.
Key findings include:
- Houses with energy-efficient features sold for a median premium of 15% (A$118,000), while units sold for 12% (A$75,000) more.
- Energy-efficient houses attract 14% more online views from potential buyers than houses without energy efficient features.
- In 2025, over half of Australian houses (52%) sold were marketed with energy-efficient features.
- Demand is strong among middle-income households, challenging the perception that sustainability is solely for affluent buyers.
- Regional areas show even stronger price premiums for energy-efficient homes than capital cities.
Reference
Sustainability in Property 2025: Demand, supply and affordability of energy-efficient homes. Domain Group, 2025.