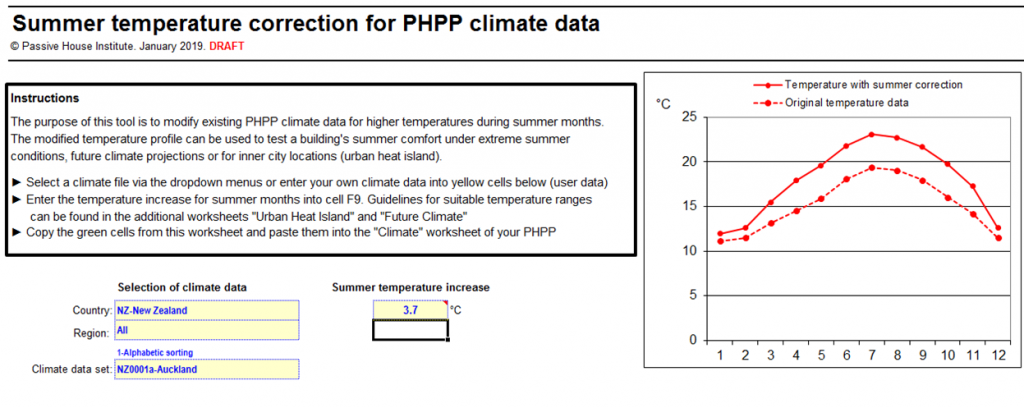
Passive House Institute has released a climate morphing tool for use in examining future climates and building resilience. I’m particularly fond of this approach which simply takes an increased summer temperature and increases the dry bulb temperatures throughout the year. After working with more detailed analysis from Meteonorm (which we use for detailed analysis including hygrothermal modeling) and other future climate tools the better precision does not result in more accurate results. The main issue is that we are all uncertain which pathway our world will take in terms of CO2 emissions and this is such a big impact the enhanced accuracy of more complicated models is silly.

The tool is now available for download on PHI’s website: Summer Temperature Tool it is also useful to assess heat island impacts for inner city locations.
At least in New Zealand the relative humidity drops most everywhere (except the rainy west coast of the south island) and we are projected to see by 2040 a 0.7C increased summer temperature in most pathways and by 2110 projecting 0.7C and 3.7C for RCP2.5 to RCP8.5 (the negative CO2 to high pathway).
These RCPs include one mitigation pathway (RCP2.6, which requires removal of some of the CO2 presently in the atmosphere), two stabilisation pathways (RCP4.5 and RCP6.0), and one pathway [RCP8.5] (essentially ‘business as usual’) with very high greenhouse gas concentrations by 2100 and beyond.
from NZ NIWA report Sept 2018 available.
According to one set of runs with Metonorm and the IPCCv4 Sydney will be similar out to 2100 (so says the computers) so this PHPP tool is very useful. I think trying to be more accurate than this is not a very good used of resources outside of science experiments.
If you want to check for climates outside of NZ or in other places in AU you can use WeatherShift.com which morphs EnergyPlus weather files. The graphic view (which is free) can be used to see the temperature to use with the PHPP morphing tool. As an example selecting RCP8.5 and Auckland yields a 3C rise in average temperatures (3.1C summer and 2.9C winter). I’d trust NIWA’s specific advice over this tool for NZ but for AU and other countries this is very useful and free.