PHI uses its own data to build climate files in PHPP. How accurate is that data set, compared to the most recent analysis of New Zealand weather carried out for NIWA? This is the question I sought to answer in a recent research project. The good news is PHPP v10.6 tracks the new Typical Meteorological Year (TMY) files quite accurately in the four diverse climate zones we studied. Read on though, and I’ll unpack some interesting background to the way these data sets are developed.
Back in 2015, Jason Quinn checked measured weather data from all the weather stations available on New Zealand’s climate network against the altitude-adjusted PHPP climate data as defined by PHI. PHI’s data was at that time based on the quite old NIWA data then available. His work was reported on at the 2015 South Pacific Passive House Conference. It was a big help for the handful of New Zealand Passive House designers working at the time as it meant climate files were available for the entire country.
TMY weather files updated
New Zealand’s first TMY files were based on data from 1970 to 2007; that’s getting pretty old given the increasing occurrence of extreme weather events. Happily, in October 2024, MBIE funded work to update them with 16 years of more recent data. The TMY months were selected from the most recent three decades of data so they more accurately reflect modern realities.
TMY is the workhorse for annual energy modelling. Each consists of hourly data from a representative month selected from different years in the historical record, thereby creating a composite “typical” year for each specific location. Engineers use TMY files extensively to predict annual heating/cooling energy use, compare design options, and demonstrate compliance with energy efficiency standards. The new TMY files give us a more accurate baseline based on recent weather patterns.
Future climate files
A notable improvement in the 2024 data set is the inclusion of three projected future climate files, TMY_M1, TMY_M2 and TMY_M3. Buildings designed today need to perform well for many decades to come so the future versions of the TMY and DSY files are based on IPCC climate change projections. They provide datasets hotter than the present-day baseline by:
- +0.5C (approximating 2040)
- +1.0C (approximating 2050)
- +2.0C (approximating 2070)
Before we look at the detail of the analysis we did for four different New Zealand cities, I want to briefly outline two other types of files that engineers use and which may be relevant to Passive House design in particular circumstances. The short version is, don’t use a TMY file (morphed or not) and expect it to account for extreme weather, they are not designed for this and the results will not be accurate.
Other useful data sets
Design Summer Year (DSY) files focus specifically on summertime conditions and what we rely on for overheating analysis. The DSY represents a hot summer that will re-occur once every seven years. These DSY files allow engineers to explore natural ventilation options and allow for these hotter summers. This is especially important given the increasing need for designs to focus on preventing overheating in summer.
The Moisture Design Reference Year (MDRY) files are essential for hygrothermal analysis carried out using tools like WUFI. MDRY files help engineers assess the risk of condensation, moisture accumulation and mould growth within building envelopes. They are constructed to represent conditions likely to challenge the moisture performance of building materials and assemblies. MDRY is produced in the WAC format used by WUFI software.
DSY1 is intended for use in CIBSE TM59 studies; all engineers should be using this file set for overheating analysis using programs like EnergyPlus and IES. Further analysis of overheating and cooling loads using zonal software may be called for when designing Passive House projects like apartment buildings. But the starting place for Passive House designers is always PHPP.
Analysis of PHPP and TMY3 by location
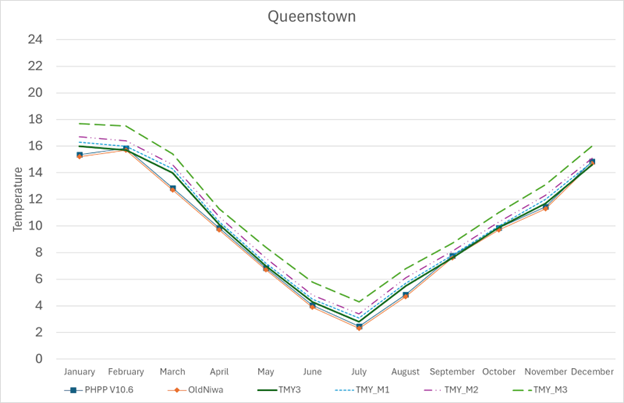
In terms of checking the accuracy of PHPP data sets, our analysis focused on four cities. We graphed TMY and the three morphed data sets against the old NIWA data and the PHPP climate files. On this basis we are comfortable saying that the files from PHI are pretty close to the latest official New Zealand weather data.
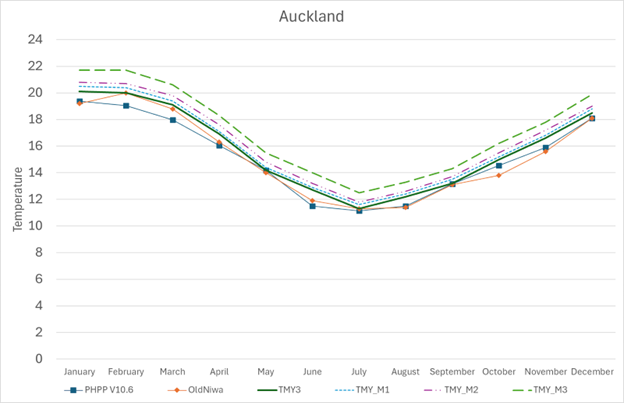
For Auckland, the updated NIWA data (TMY3) shows warmer temperatures compared to both PHPP v10.6 and the old NIWA data, with the most difference in spring and autumn.
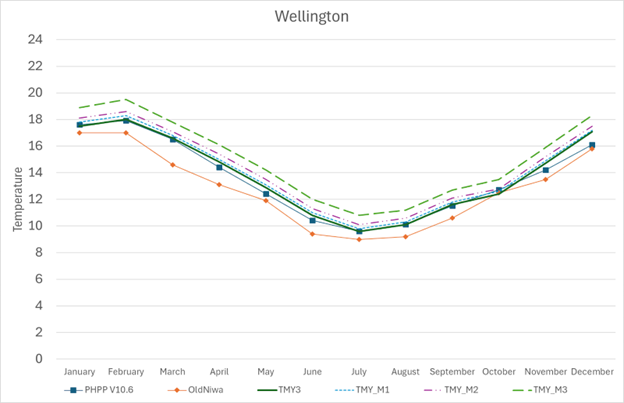
Wellington showed the biggest difference between the old NIWA data and TMY3, which very closely maps onto PHPP v10.6. We can be confident of PHPP’s climate data in this location but it is sobering to see a difference in March temperatures of nearly two degrees just in the lifetime of many Passive House designers. The graph indicates the biggest variations from the old NIWA data occur during the shoulder seasons.
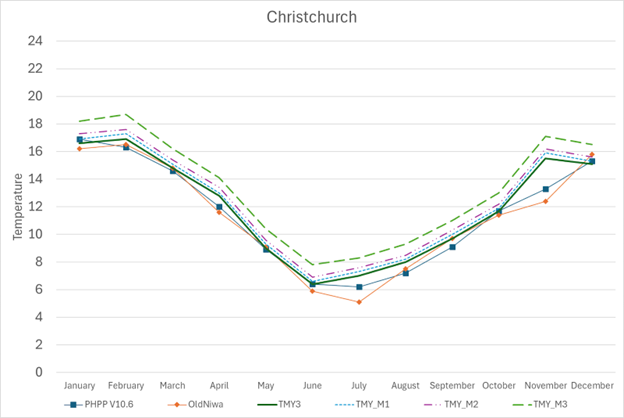
Christchurch data shows considerably warmer winter temperatures in TMY3 compared with the old NIWA data and to a lesser extent PHPP. The largest deviation between TMY3 and PHPP in all four cities was in July in Christchurch (0ld NIWA temperature was 5.1C, PHPP 6.2C and TMY 7.0C.)