I don’t mean the human ones, who are employed to sell us everything from clothes to cars. I’m talking about computer models, the kind that geeky engineers like me get excited about. As an industry, we’d create much better results for our clients (and consequentially, our own businesses) if predictive energy modelling were more widely used. This is just as true for retrofits and renovations as it is for new builds.
This month I’m going to walk you through several of the modelling packages I use and how they eliminate the performance gap that engineers moan about. (When your finished building doesn’t work like you expected it to when you designed it? That’s a performance gap.)
There’s a lamentable lack of modelling in the building industry in New Zealand. It’s particularly regrettable when clients (and their design team) are well-meaning but don’t check their assumptions. The design team for a high-end residence in Auckland cared enough about performance to specify high-end glazing, one that’s designed to capture heat. This home used little energy for heating in winter but overheated so badly in summer it was virtually uninhabitable. Energy-modelling this design (before construction started) would have predicted this problem. It’s always cheaper to fix a problem on paper, before the concrete is poured. In this case, the design team could have saved money by using cheaper glazing, specified some shading on the west face and built a home comfortable and efficient year-round.
I spend most of my modelling hours using PHPP, the Passive House Planning Package. This is a great tool and it can be usefully applied to any building project: commercial or residential, high-performance or just to code. It is of course indispensable if your client is expecting a Certified Passive House building (it is required for certification).
PHPP hits the sweet spot of being accurate and useful—and simple enough to be verifiable. It accurately predicts the amount of energy a building will use for heating and cooling (so understand first of all that it doesn’t predict the entire energy bill. It’s not measuring appliance use, for example.) Although people still primarily focus on the cost of heating New Zealand homes, the need for cooling in summer is becoming more of an issue as heatwaves become more frequent. PHPP is very good at predicting a design’s likelihood of overheating or not.
Secondly, PHPP has a huge advantage over other modelling tools in that it was developed to predict actual performance, not just demonstrate code compliance. As energy consumption plummets in high-performance homes, small things have a proportionally bigger impact and PHPP is setup to consider these impacts. Code compliance models are not intended to predict performance and neglect these important details to make them ‘simpler’.
Co-heating tests have proved the accuracy of PHPP modelling. These are fun: they exclude all the variables (including people, the most variable of them all) so the results are very reliable. Take a look at Figure 1 below. The researchers took several houses that had been modelled to predict energy consumption for heating prior to being built. Their occupants were sent on holiday for a week or two, then all the doors and windows were closed, and giant portable electrical heaters installed to maintain a constant indoor temperature. The outside temperature and other weather factors were all recorded. Thus the heating load is accurately established in-situ and can be compared to what the model predicted.

Figure 1. Co-heating testing paper: David Johnston and Mark Siddall, “The Building Fabric Thermal Performance of Passivhaus Dwellings—Does it do what it says on the Tin?” Sustainability 2016, 8, 97; doi:10.3390/su8010097
You can see at a glance that the modelling of most of the houses significantly under-estimated the heating demand. But the Passive House buildings, highlighted on the right and modelled using PHPP are spot on.
Figure 2 illustrates my point about people being the biggest variables in actual energy use. Each vertical blue line on the X-axis is an individual house or apartment. You’ll notice that there’s a big variation in the amount of energy required for heating. That’s down to the circumstances and preferences of the home’s occupants. I remember a researcher telling me about two identical test houses they had built where the monitored heating differences were very large between them. When they monitored the occupants they found one was super thrifty and barely used the heating while the other thought it was great they could leave the back door open for their dog all day in the winter and the heat pump could still keep their home nice and toasty.
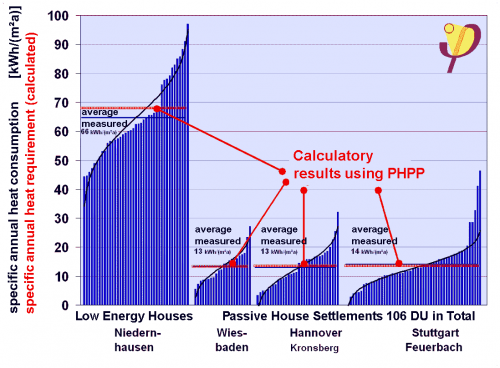
Figure 2. Overview of consumption measurements. Source: http://bit.ly/2MYlzBg
But, when you average out the buildings as a group, there’s virtually no gap between the predicted and actual performance of the dwellings. PHPP is doing its job of predicting the heating demand. (Remember the adage: all models are wrong, but some are useful. To which I would add, and some are less wrong on average.)
It is important to understand that PHPP, like all tools, has its limitations; not everything is a nail.
- PHPP treats the entire interior of a building as a single thermal zone with an average temperature. This is fine in almost all cases, but judgement needs to be applied; Imagine for a moment a house with two wings. One is always shaded by the neighbouring house and the other has a wall of north- or west-facing glazing with no shade. It might be 10 degrees down one end and 30 degrees at the other. The average is a comfortable 20 degrees, but that doesn’t correlate to the occupants’ comfort. For this sort of design if I can’t change the layout, we’d need to use another tool.
- Neither is PHPP transient. PHPP predicts monthly averages, which is fine for predicting energy consumption and design day equations for sizing heating/cooling equipment and overheating but won’t tell you how the air temperature varies each hour throughout the year.
- The ventilation energy usage is accurately modelled but the heating, ventilation and air conditioning components are simplified. PHPP is concerned with how much energy comes in and out the building, both through the air and through the building envelope of the building. It doesn’t model the HVAC equipment in detail.
This means there are times I open up other tools. I often use Energy Plus, which is great software. Its physics are more detailed than PHPP (I love physics) and I can dive down into a lot of detail to understand how the temperature might vary in different parts of the building or even how it changes minute-by-minute in response to sunlight penetration, for example.
But this kind of detail costs. It’s time-consuming to set up the model and once the simulation is run, just looking at the data it outputs can take longer than running a PHPP model and writing the report. That time costs money. PHPP’s limitations aren’t generally applicable to single-family homes or even apartment buildings or small office buildings. But it’s nice to know that more detailed (and complicated) models are available when they are needed.
PHPP is a giant Excel spreadsheet. As an architect or architectural designer, you can take a course offered by PHINZ and learn how to use it yourself. Or, you can outsource the modelling to a growing number of New Zealand consultants who are now very good and fast at using PHPP.