Tech Tips with Toby
Variants is a handy tool when using PHPP to model multiple design options within the one PHPP file. Suppose you’re trying different window frames, glazing or types of insulation: the variants tab is the place to do it. The Excel tool behind how that sheet works is called DataTables. To understand how the variants sheet works, it’s best to start with the simplest form of DataTables.
In my last article, we discussed what-if analysis with goal seek; DataTables is another tool in that same menu. In this example, I want to investigate how changing the thickness of the roof insulation impacts the building’s heating demand. I already know that as the first increases, the second value will reduce. But by how much, exactly?
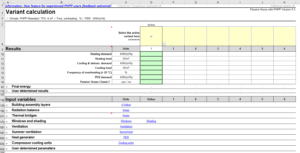
I set up a new sheet in PHPP named Datatables and enter two inputs and two outputs as shown below:
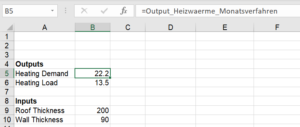
The Heating Demand and Load need to refer to the outputs on the verification sheet, while the inputs need to link back to the input in PHPP as shown below:
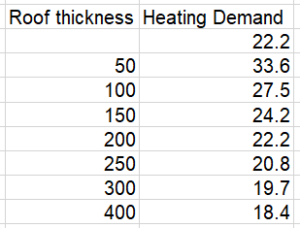
The simplest table has one input and one output. Go to the Data menu → What-If Analysis → DataTables and enter the roof thickness as a column input cell. It’s simple to set up a table to see how the thickness of the roof insulation affects the heating demand. (I’ve done this as a column but it can also be done as rows.)
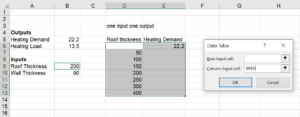
The outcome is as you would expect:
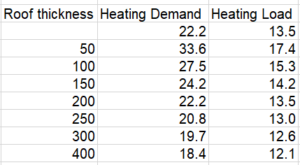
It’s easy to set up with two (or more) outputs (if you want more detail, there are lots of online tutorials on DataTables):
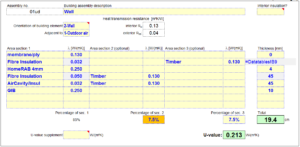
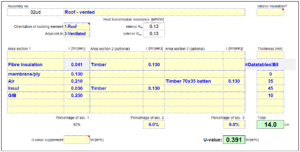
If we wanted to consider the wall and roof thickness and how it affects the heating demand, we can set up a table like this:
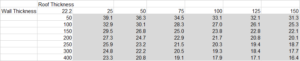
Again, the thicker the insulation in either the roof or walls, the lower the heating demand—as shown in the grey cells.
This is useful, at least for certain cases. But each time you want to investigate how an input changes the building performance would need a sheet with a datatable, which could take a lot of time and effort. Luckily for us, PHPP has a sheet that does this for us. The Variants worksheet is a large DataTable with multiple inputs, which uses multiple different scenarios. A variants file can have up to 99 scenarios but normally shows six.
Toby Brooke is a Building Science Analyst at Sustainable Engineering Ltd
Two things that still trip me up at times.
1. If your data table fills with ZEROS then look at the calculation options and make sure it’s on automatic. One option is automatic ‘except data tables’ which means it fills with zeros. This has caused my much frustration in the past.
2. If you want more than two variables you can use scenarios and use any number of variables – which is how the VARIANTS sheet works. Good video here: https://www.youtube.com/watch?v=27lqKqmxL2o&t=145s