This is an excellent paper on modelling the carbon emitted by New Zealand homes during construction and use against the IPCC 1.5 degree emission targets. The authors follow population weighting all the way down. I recommend reading the whole thing.
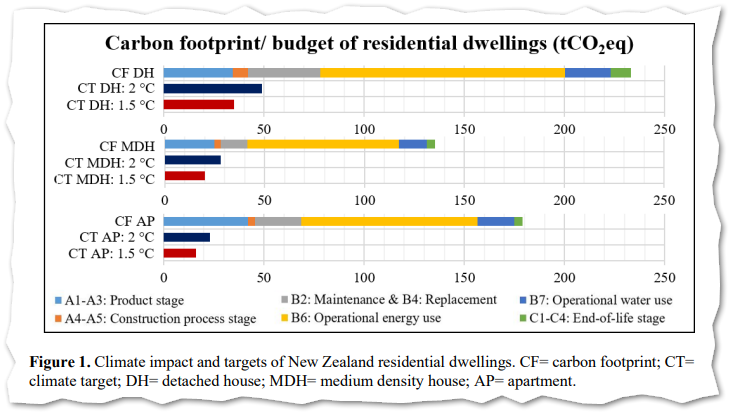
Figure 1 shows the current estimates for New Zealand new construction Life Cycle Analysis (LCA) carbon emissions for the next 33 years in tons of CO2e per dwelling. The CT dark blue and red bars are the Climate Targets for 1.5 or 2.0 degrees respectively.
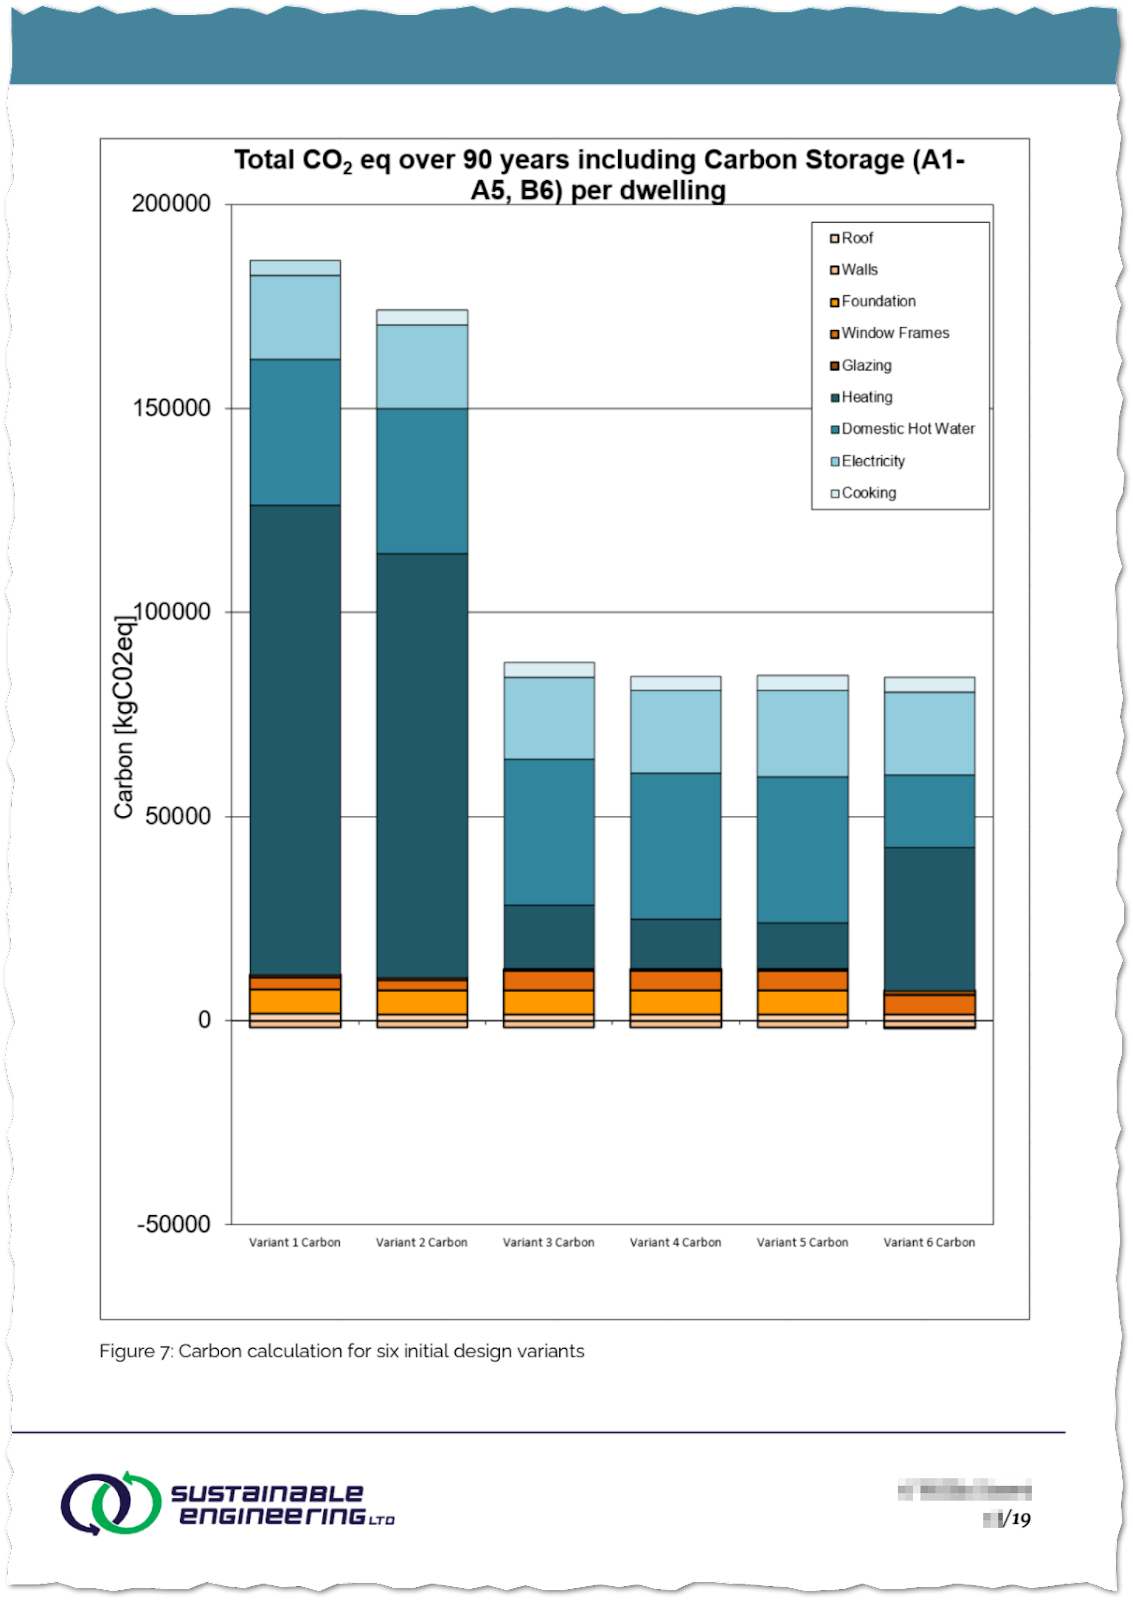
There are some technical details I’d like to argue. The point I argue with embodied carbon policy wonks is that buildings do (and should) last at least 90 years. Using 50- or 33-year spans for analysing life cycle impacts distorts the data by over-emphasising the carbon implications of embodied carbon and under-estimating operational carbon. It further serves to undermine economic rationales for creating better, more energy-efficiency buildings (‘What, more insulation? You’ve just increased embodied carbon!’). Never mind that a Passive House building uses 90% less energy for heating and cooling for every single year it is lived in. All 90 of those years, and more.
Further, presenting this data in this way makes it look like the carbon emissions will just stop in 2050 (the authors have made an assumption we’ll be successful in reaching zero net carbon at that time). This has the effect of inflating the relative importance of embodied carbon. It’s still smaller than operational carbon but a decent size. What happens in 2050? Unless we hit the net zero carbon target in 2050 it doesn’t make sense.
Embodied carbon is critical to reducing housing carbon emissions but taking a short-sighted view results in somewhat silly results. If we pretend it’s 2045 and plot data this way we’d see all embodied carbon on this graph and almost no operational carbon.
LCA analysis is massively impacted by the length of the life cycle that is chosen. Here is the relative weighting of embodied vs operational carbon in Sustainable Engineering’s graphs, which take a 90-year operational life versus the 33-years used in the McLaren paper. The largest portion of the stacked bar represents the operational carbon (in blue); this area instantly drops to one third when the time frame is only 33 years.